#33266Rango de frecuencia de búsqueda: #33266
seafood
Amazon Brand Analytics ranking the top 3 products, categories, and brands for "seafood".
- Click share
- 11.38%
- Combined top 3
- Leader
- 4.19%
- Top product click share
01Productos de seafood con Más Conversiones
Productos de seafood con Más Conversiones
Combined click share11.38%
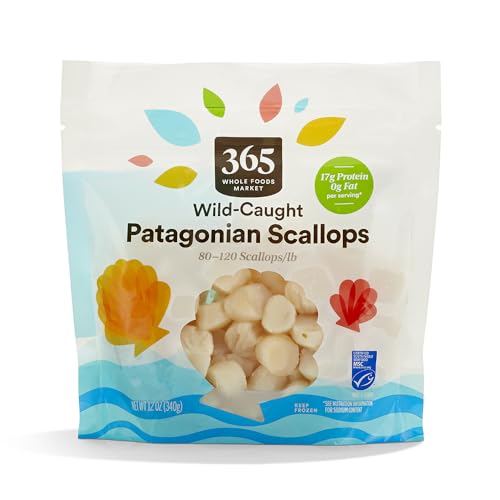
365 By Whole Foods Market, Sea Scallops, Patagonian Msc, 80/120 Count, 12 Ounce
- Participación de clics
- 4.19%
- Participación de conversión
- 3.94%
ASIN
B0CZG7XZMB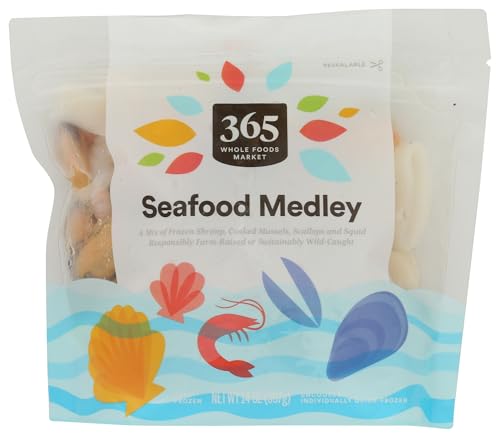
365 by Whole Foods Market, Seafood Medley, 14 Ounce
- Participación de clics
- 3.72%
- Participación de conversión
- 2.36%
ASIN
B0DPR6LDC2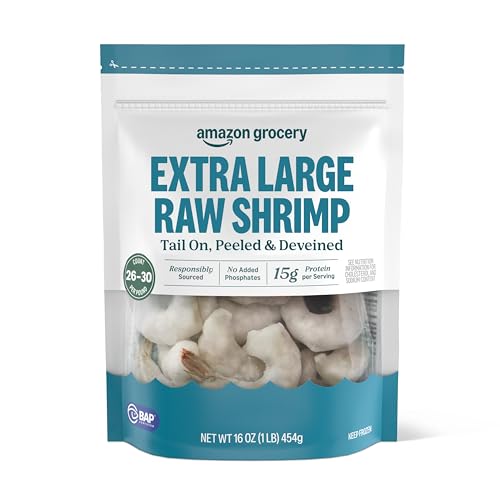
Amazon Fresh Brand, Raw Extra Large Peeled & Deveined Tail On Shrimp (26 to 30 Count/Po...
- Participación de clics
- 3.47%
- Participación de conversión
- 2.19%
ASIN
B07ZS338CG02Categorías de seafood Más Populares en Amazon
Categorías de seafood Más Populares en Amazon
03Marcas de seafood Mejor Valoradas
Marcas de seafood Mejor Valoradas
04Listing insights
What "seafood" buyers are looking for.
Use the demand signals above to write listings that match how Amazon shoppers describe "seafood". Start with the highest-converting products and brands, then mirror the language and attributes that show up most often in the top results.
01
Match buyer intent
Use the words shoppers actually search for when looking up "seafood".
02
Mirror top categories
Reflect the same product positioning that the top categories use.
03
Compare against brands
Check how leading brands describe similar products and find your differentiation.
Use this data
Generate an Amazon listing for "seafood".
Bring this demand insight back into the live Amazon Listing Optimizer to generate a tailored title, bullets, description, and backend search terms.