#10191Zoekfrequentierang: #10191
oculus
Amazon Brand Analytics ranking the top 3 products, categories, and brands for "oculus".
- Click share
- 53.55%
- Combined top 3
- Leader
- 23.27%
- Top product click share
01Meest Geconverteerde oculus Producten
Meest Geconverteerde oculus Producten
Combined click share53.55%
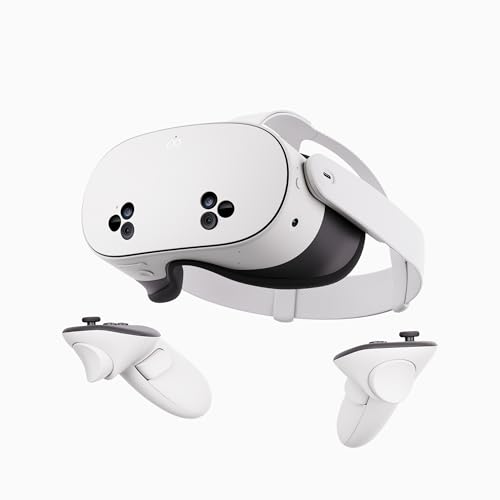
Meta Quest 3S 128GB — Dive into Mixed Reality — Unreal device. Unreal price. — Gorilla ...
- Klikaandeel
- 23.27%
- Conversieaandeel
- 49.67%
ASIN
B0F2GYMC8H
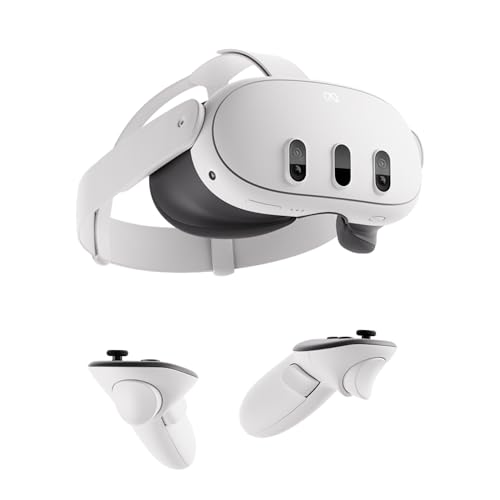
Meta Quest 3 512GB — The Most Powerful Quest — Ultimate Mixed Reality Experiences — Get...
- Klikaandeel
- 10.84%
- Conversieaandeel
- 12.91%
ASIN
B0CD1JTBSC02Populairste oculus Categorieën op Amazon
Populairste oculus Categorieën op Amazon
03Best Beoordeelde oculus Merken
Best Beoordeelde oculus Merken
04Listing insights
What "oculus" buyers are looking for.
Use the demand signals above to write listings that match how Amazon shoppers describe "oculus". Start with the highest-converting products and brands, then mirror the language and attributes that show up most often in the top results.
01
Match buyer intent
Use the words shoppers actually search for when looking up "oculus".
02
Mirror top categories
Reflect the same product positioning that the top categories use.
03
Compare against brands
Check how leading brands describe similar products and find your differentiation.
Use this data
Generate an Amazon listing for "oculus".
Bring this demand insight back into the live Amazon Listing Optimizer to generate a tailored title, bullets, description, and backend search terms.